Sources of data for the NIS
Nutrition information can be generated from active surveillance activities (e.g. pocket surveys) which require an active data search. One of the major disadvantages of an active data generation strategy is that it is very costly. Secondly, it is difficult to develop uniform indicators that can detect progress in the common nutrition success indicators at national levels because the data from the active surveillance usually come from small studies which are not representative of the different regions.
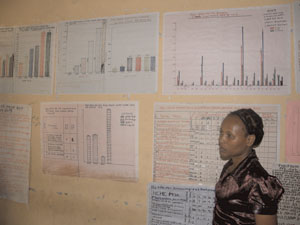
The alternative is using data from the routine service records such as growth monitoring records. The data you record and report from community-based nutrition activities, child health days and therapeutic feeding programmes could be used to generate uniform indicators for looking at trends in indicators of certain nutrition situations. This allows comparisons over time across all regions of the country (either by yearly or seasonal variation). So your role in providing accurate and clear information is very important (Figure 13.3).

Box 13.1 sets out the kinds of data you would collect from community-based nutrition (CBN) programmes and therapeutic feeding programmes (TFP) and what indicators can be drawn from the data of community level and how the data might be used nationally.
Interpreting changes in nutrition indicators requires an understanding of the normal levels of undernutrition in the community, as well as agricultural, economic, health, and other factors. As you run your routine CBN services, the data generated as a result of these services could be useful in calculating key nutritional indicators that can support effective decision making.
Box 13.1 Routine service data to estimate nutrition status of a community
| Data (collect and record monthly) | Indicator | National relevance | |
|---|---|---|---|
| CBN | Total number of children under two years old with weight for age <-2 and >-3SD | Prevalence of moderate underweight | Growth performance |
| Total number of children under two years old with weight for age <-3SD | Prevalence of severe underweight | Growth performance | |
| TFP | Number of children who were admitted | Baseline information | |
| Number of children (and percentage of total) who stopped attending the programme | 'Defaulter' rate | Take up of the programme; enables community and regional comparisons | |
| Number (and percentage) of children who failed to recover fully | Treatment failure | Informs continuing improvement in programme design | |
| Number of children (and percentage) who died | Mortality rate | Progress towards MDGs; informs national strategy for community nutrition interventions |
The information in Box 13.1 is just an example of the kind of data collection you'll be expected to carry out. As you've read in the other study sessions in this Module, you will be collecting a range of measurements (height, length, MUAC) and other information (e.g. vitamin A coverage, de-worming coverage, households screen or iodised salt use) that together help to provide a detailed picture of the nutritional status of your community.
Why is it important to have an NIS?
Show answer
As long as data is recorded accurately and communicated in a timely way, it provides a source of information (indicators) that will help create appropriate and effective solutions to address the nutritional needs in communities.
Indicators are useful for community programme planning to establish priorities for problems, set goals, formulate plans of action and implement, monitor, and evaluate community efforts aimed at achieving the Millennium Development Goals (MDGs). Each village then can determine its requirements and plan for further action, based on the indicators generated, that will best address its particular nutritional needs.